Showing posts with label Chapter 15: Investments and Fair Value Accounting. Show all posts

PR 15-4B Investment reporting

Teasdale Inc. manufactures and sells commercial and residential security equipment. The comparative unclassified balance sheets for December 31, 2015 and 2014 are provided below. Selected missing balances are shown by letters.


Teasdale Inc.
Balance Sheet
December 31, 2015 and 2014
Dec. 31, 2015 Dec. 31, 2014
Cash $160,000 $156,000
Accounts receivable (net) 115,000 108,000
Available-for-sale investments (at cost)—Note 1 a. 91,200
Plus valuation allowance for available-for-sale investments b. 8,776
Available-for-sale investments (fair value) $ c. $ 99,976
Interest receivable $ d. —
Investment in Wright Co. stock—Note 2 e. $ 69,200
Office equipment (net) 96,000 105,000
Total assets $ f. $538,176
Accounts payable $ 91,000 $ 72,000
Common stock 80,000 80,000
Excess of issue price over par 250,000 250,000
Retained earnings g. 127,400
Unrealized gain (loss) on available-for-sale investments h. 8,776
Total liabilities and stockholders’ equity $ i. $538,176
Note 1. Investments are classified as available for sale. The investments at cost and
fair value on December 31, 2014, are as follows:
No. of Shares Cost per Share Total Cost Total Fair Value
Alvarez Inc. stock 960 $38.00 $36,480 $39,936
Hirsch Inc. stock 1,900 28.80 54,720 60,040
$91,200 $99,976

Note 2. The Investment in Wright Co. stock is an equity method investment representing 30% of the outstanding shares of Wright Co.

The following selected investment transactions occurred during 2015:

Mar. 18. Purchased 800 shares of Richter Inc. at $40 including brokerage commission. Richter is classified as an available-for-sale security.

July 12. Dividends of $12,000 are received on the Wright Co. investment.

Oct. 1. Purchased $24,000 of Toon Co. 4%, 10-year bonds at 100. The bonds are classified as available for sale. The bonds pay interest on October 1 and April 1.

Dec. 31. Wright Co. reported a total net income of $80,000 for 2015. Teasdale recorded equity earnings for its share of Wright Co. net income.

Dec. 31. Accrued interest for three months on the Toon Co. bonds purchased on October 1.

31. Adjusted the available-for-sale investment portfolio to fair value, using the following fair value per-share amounts:


Available-for-Sale
Investments Fair Value
Alvarez Inc. stock $41.50 per share
Hirsch Inc. stock $26.00 per share
Richter Inc. stock $48.00 per share
Toon Co. bonds 101 per $100 of face amount


31. Closed the Teasdale Inc. net income of $51,240 for 2015. Teasdale Inc. paid no dividends during 2015.


Instructions

Determine the missing letters in the unclassified balance sheet. Provide appropriate supporting calculations.


Answer:


a. $147,200 (from table)
b. $4,680 ($151,880 – $147,200, from table)
c. $151,880 (from table)
Market
Cost per Value per
No. of Share (or Share (or
Shares (or $100 of $100 of Total Fair
face amount) face amount) face amount) Cost Value
Alvarez Inc. stock…… 960 $38.00 $41.50 $ 36,480 $ 39,840
Hirsch Inc. stock……… 1,900 28.80 26.00 54,720 49,400
Richter Inc. stock…… 800 40.00 48.00 32,000 38,400
Toon Co. bonds……… $24,000 100 101 24,000 24,240
$147,200 $151,880
d. $240 ($24,000 × 4% × 3/12)
e. $81,200 [$69,200 + ($80,000 × 30%) – $12,000]
f. $604,320 ($160,000 + $115,000 + $151,880 + $240 + $81,200 + $96,000)
g. $178,640 ($127,400 + $51,240)
h. $4,680 [same as (b)]
i. $604,320 ($91,000 + $80,000 + $250,000 + $178,640 + $4,680)
The completed comparative unclassified balance sheets are as follows:
TEASDALE, INC.
Balance Sheet
December 31, 2015 and 2014
Dec. 31,
2015
Dec. 31,
2014
Cash $160,000 $156,000
Accounts receivable (net) 115,000 108,000
Available-for-sale investments (at cost)—Note 1 $147,200 $ 91,200
Plus valuation allowance for available-for-sale
investments 4,680 8,776
Available-for-sale investments (fair value) $151,880 $ 99,976
Interest receivable $ 240 $ —
Investment in Wright Co. stock—Note 2 81,200 69,200
Office equipment (net) 96,000 105,000
Total assets $604,320 $538,176
Accounts payable $ 91,000 $ 72,000
Common stock 80,000 80,000
Excess of issue price over par 250,000 250,000
Retained earnings 178,640 127,400
Unrealized gain (loss) on available-for-sale
investments 4,680 8,776
Total liabilities and stockholders’ equity $604,320 $538,176
Note 1. Investments are classified as available for sale. The investments at cost
and fair value on December 31, 2014, are as follows:
No. of Cost per Total Total Fair
Shares Share Cost Value
Alvarez Inc. stock…………………… 960 $38.00 $36,480 $39,936
Hirsch Inc. stock…………………… 1,900 $28.80 54,720 60,040
$91,200 $99,976
For December 31, 2015:
Market
Cost per Value per
No. of Share (or Share (or
Shares (or $100 of $100 of Total Fair
face amount) face amount) face amount) Cost Value
Alvarez Inc. stock… 960 $38.00 $41.50 $ 36,480 $ 39,840
Hirsch Inc. stock…… 1,900 28.80 26.00 54,720 49,400
Richter Inc. stock… 800 40.00 48.00 32,000 38,400
Toon Co. bonds…… $24,000 100 101 24,000 24,240
$147,200 $151,880
Note 2. The Investment in Wright Co. stock is an equity method investment
representing 30% of the outstanding shares of Wright Co.

PR 15-3B Stock investment transactions, equity method and available-for-sale securities

Glacier Products Inc. is a wholesaler of rock climbing gear. The company began operations on January 1, 2014. The following transactions relate to securities acquired by Glacier Products Inc., which has a fiscal year ending on December 31:

2014
Jan. 18. Purchased 9,000 shares of Malmo Inc. as an available-for-sale investment at $40 per share, including the brokerage commission.

July 22. A cash dividend of $3.00 per share was received on the Malmo stock.

Oct. 5. Sold 500 shares of Malmo Inc. stock at $58.00 per share, less a brokerage commission of $100.

Dec. 18. Received a regular cash dividend of $3.00 per share on Malmo Inc. stock.

31. Malmo Inc. is classified as an available-for-sale investment and is adjusted to a fair value of $36.00 per share. Use the valuation allowance for available-for sale investments account in making the adjustment.


2015
Jan. 25. Purchased an influential interest in Helsi Co. for $800,000 by purchasing 75,000 shares directly from the estate of the founder of Helsi. There are 250,000 shares of Helsi Co. stock outstanding.

July 16. Received a cash dividend of $3.00 per share on Malmo Inc. stock.

Dec. 16. Received a cash dividend of $3.00 per share plus an extra dividend of $0.20 per share on Malmo Inc. stock.

Dec. 31. Received $38,000 of cash dividends on Helsi Co. stock. Helsi Co. reported net income of $170,000 in 2015. Glacier Products Inc. uses the equity method of accounting for its investment in Helsi Co.

31. Malmo Inc. is classified as an available-for-sale investment and is adjusted to a fair value of $44 per share. Use the valuation allowance for available-for sale investments account in making the adjustment for the increase in fair value from $36 to $44 per share.

Instructions
1. Journalize the entries to record the preceding transactions.

2. Prepare the investment-related asset and stockholders’ equity balance sheet presentation for Glacier Products Inc. on December 31, 2015, assuming the Retained Earnings balance on December 31, 2015, is $700,000.


Answer:


1.
2014
Jan. 18 Investments—Malmo Inc.* 360,000
Cash 360,000
*9,000 shares × $40 per share
July 22 Cash* 27,000
Dividend Revenue 27,000
*9,000 shares × $3.00 per share
Oct. 5 Cash* 28,900
Gain on Sale of Investments 8,900
Investments—Malmo Inc.** 20,000
*(500 shares × $58.00) – $100
**500 shares × $40 per share
Dec. 18 Cash* 25,500
Dividend Revenue 25,500
*(9,000 shares – 500 shares) × $3.00
31 Unrealized Gain (Loss) on Available-forSale
Investments 34,000
Valuation Allowance for Available-forSale
Investments 34,000
8,500 shares × ($36.00 – $40).
2015
Jan. 25 Investment in Helsi Co. Stock 800,000
Cash 800,000
July 16 Cash* 25,500
Dividend Revenue 25,500
*8,500 shares × $3.00 per share
Dec. 16 Cash* 27,200
Dividend Revenue 27,200
*8,500 shares × ($3.00 + $0.20)
31 Cash 38,000
Investment in Helsi Co. Stock 38,000
31 Investment in Helsi Co. Stock 51,000
Income of Helsi Co. 51,000
To record 30% of Helsi Co. income
$170,000 × (75,000 shares ÷ 250,000
shares).
31 Valuation Allowance for Available-forSale
Investments* 68,000
Unrealized Gain (Loss) on Available-forSale
Investments 68,000
*8,500 × ($44 – $36.00)
2.
 GLACIER PRODUCTS, INC.
Balance Sheet (selected items)
December 31, 2015
Current assets:
Available-for-sale investments (at cost)
1 $340,000
Plus valuation allowance for available-forsale
investments 34,000
Available-for-sale investments (at fair value)
2 $374,000
Investments:
Investment in Helsi Co. stock3 $813,000
Stockholders’ equity:
Retained earnings $700,000
Unrealized gain (loss) on available-for-sale
investments 34,000
1 8,500 shares × $40 per share
2 8,500 shares × $44 per share
3 $800,000 + $51,000 – $38,000

PR 15-2B Stock investment transactions, trading securities

Zeus Investments Inc. is a regional investment company that began operations on January 1, 2014. The following transactions relate to trading securities acquired by Zeus Investments Inc., which has a fiscal year ending on December 31:

2014
Feb. 14. Purchased 4,800 shares of Apollo Inc. as a trading security at $26 per share plus a brokerage commission of $192.

Apr. 1. Purchased 2,300 shares of Ares Inc. as a trading security at $19 per share plus a brokerage commission of $92.

June 1. Sold 600 shares of Apollo Inc. for $32 per share less a $100 brokerage commission.

27. Received an annual dividend of $0.20 per share on Apollo Inc. stock.

Dec. 31. The portfolio of trading securities was adjusted to fair values of $33 and $18.50 per share for Apollo Inc. and Ares Inc., respectively.

2015
Mar. 14. Purchased 1,200 shares of Athena Inc. as a trading security at $65 per share plus a $120 brokerage commission.

June 26. Received an annual dividend of $0.21 per share on Apollo Inc. stock.

July 30. Sold 480 shares of Athena Inc. for $60 per share less a $50 brokerage commission.

Dec. 31. The portfolio of trading securities had a cost of $200,032 and a fair value of $188,000, requiring a credit balance in Valuation Allowance for Trading Investments of $12,032 ($200,032 2 $188,000). Thus, the debit balance from
December 31, 2014, is to be adjusted to the new balance.


Instructions
1. Journalize the entries to record these transactions.

2. Prepare the investment-related current asset balance sheet presentation for Zeus Investments Inc. on December 31, 2015.

3. How are unrealized gains or losses on trading investments presented in the financial statements of Zeus Investments Inc.?


Answer:


1.

2014
Feb. 14 Investments—Apollo Inc.* 124,992
Cash 124,992
*(4,800 shares × $26 per share) + $192
Apr. 1 Investments—Ares Inc.* 43,792
Cash 43,792
*(2,300 shares × $19 per share) + $92
June 1 Cash* 19,100
Gain on Sale of Investments 3,476
Investments—Apollo Inc.** 15,624
*(600 shares × $32 per share) – $100
**600 shares × ($124,992 ÷ 4,800 shares)
27 Cash* 840
Dividend Revenue 840
*(4,800 shares – 600 shares) × $0.20
Dec. 31 Valuation Allowance for Trading Investments* 27,990
Unrealized Gain on Trading Investments 27,990
* $181,150 – $153,160, in table below
Number
of
Shares
Cost
per
Share
Fair Value Fair
per Share Cost Value
Apollo Inc..................................... 4,200 $26.041 $33.00 $109,368 $138,600
Ares Co. ....................................... 2,300 $19.042 $18.50 43,792 42,550
Total.............................................. $153,160 $181,150
1 $124,992 ÷ 4,800 shares = $26.04 per share
2 $43,792 ÷ 2,300 shares = $19.04 per share
2015
Mar. 14 Investments—Athena Inc.* 78,120
Cash 78,120
*(1,200 shares × $65 per share) + $120
June 26 Cash* 882
Dividend Revenue 882
*4,200 shares × $0.21 per share
July 30 Cash* 28,750
Loss on Sale of Investments 2,498
Investments—Athena Inc.** 31,248
*(480 shares × $60 per share) – $50
**480 shares × ($78,120 ÷ 1,200 shares)
Dec. 31 Unrealized Loss on Trading Investments* 40,022
Valuation Allowance for Trading Investments* 40,022
*$27,990 + $12,032
2.
 ZEUS INVESTMENTS INC.
Balance Sheet (selected items)
December 31, 2015
Current assets:
Trading investments (at cost)* $200,032
Less valuation allowance for trading investments 12,032
Trading investments (at fair value) $188,000
*$153,160 (from Dec. 31, 2014) + $78,120 – $31,248
3. Unrealized gains or losses are reported in the income statement, often
as “Other Income (Losses).” For 2014, Zeus Investments Inc. would have
reported an unrealized gain of $27,990 as “Other Income.” For 2015, Zeus
Investments Inc. would have reported an unrealized loss of $40,022 as
“Other Losses.” If unrealized gains and losses were significant for Zeus
Investments, then they would be separately disclosed on the income
statement.

PR 15-1B Debt investment transactions, available-for-sale valuation

Rekya Mart Inc. is a general merchandise retail company that began operations on January 1, 2014. The following transactions relate to debt investments acquired by Rekya Mart Inc., which has a fiscal year ending on December 31:

2014
Apr. 1. Purchased $90,000 of Smoke Bay 6%, 10-year bonds at their face amount plus accrued interest of $900. The bonds pay interest semiannually on February 1 and August 1.

May 16. Purchased $42,000 of Geotherma Co. 4%, 12-year bonds at their face amount plus accrued interest of $70. The bonds pay interest semiannually on May 1 and November 1.

Aug. 1. Received semiannual interest on the Smoke Bay bonds.

Sept. 1. Sold $12,000 of Smoke Bay bonds at 101 plus accrued interest of $60.

Nov. 1. Received semiannual interest on the Geotherma Co. bonds.

Dec. 31. Accrued $1,950 interest on the Smoke Bay bonds.

31. Accrued $280 interest on the Geotherma Co. bonds.


2015
Feb. 1. Received semiannual interest on the Smoke Bay bonds.
May 1. Received semiannual interest on the Geotherma Co. bonds.


Instructions
1. Journalize the entries to record these transactions.

2. If the bond portfolio is classified as available for sale, what impact would this have on financial statement disclosure?


Answer:


1.
 2014
Apr. 1 Investments—Smoke Bay Bonds 90,000
Interest Receivable 900
Cash 90,900
May 16 Investments—Geotherma Co. Bonds 42,000
Interest Receivable 70
Cash 42,070
Aug. 1 Cash* 2,700
Interest Receivable 900
Interest Revenue 1,800
*$90,000 × 6% × 1/2
Sept. 1 Cash* 12,180
Interest Revenue 60
Gain on Sale of Investment 120
Investments—Smoke Bay Bonds 12,000
*($12,000 × 1.01) + $60
Nov. 1 Cash* 840
Interest Receivable 70
Interest Revenue 770
*$42,000 × 4% × 1/2
Dec. 31 Interest Receivable 1,950
Interest Revenue 1,950
Accrued interest.
31 Interest Receivable 280
Interest Revenue 280
Accrued interest.
2015
Feb. 1 Cash* 2,340
Interest Receivable 1,950
Interest Revenue 390
*$78,000 × 6% × 1/2
May 1 Cash* 840
Interest Receivable 280
Interest Revenue 560
*$42,000 × 4% × 1/2
2. If the bonds are classified as available-for-sale securities, then the portfolio
of bonds would need to be adjusted to fair value. This would be accomplished
by using a valuation allowance account and an unrealized gain (loss) account.
If the fair value were greater than the cost of the bond portfolio, the two accounts
would be positive, and thus added to investments and stockholders’ equity,
respectively. If the fair value were less than the cost of the bond portfolio, the two
accounts would be negative, and thus subtracted from investments and
stockholders’ equity, respectively.

PR 15-4A Investment reporting

O’Brien Industries Inc. is a book publisher. The comparative unclassified balance sheets for December 31, 2015 and 2014 are provided below. Selected missing balances are shown by letters.


O’Brien Industries Inc.
Balance Sheet
December 31, 2015 and 2014
Dec. 31, 2015 Dec. 31, 2014
Cash $233,000 $220,000
Accounts receivable (net) 136,530 138,000
Available-for-sale investments (at cost)—Note 1 a. 103,770
Less valuation allowance for available-for-sale investments b. 2,500
Available-for-sale investments (fair value) $ c. $101,270
Interest receivable $ d. —
Investment in Jolly Roger Co. stock—Note 2 e. $ 77,000
Office equipment (net) 115,000 130,000
Total assets $ f. $666,270
Accounts payable $ 69,400 $ 60,000
Common stock 70,000 70,000
Excess of issue price over par 225,000 225,000
Retained earnings g. 308,770
Unrealized gain (loss) on available-for-sale investments h. 2,500
Total liabilities and stockholders’ equity $ i. $666,270
Note 1. Investments are classified as available for sale. The investments at cost and
fair value on December 31, 2014, are as follows:
No. of Shares Cost per Share Total Cost Total Fair Value
Bernard Co. stock 2,250 $17 $ 38,250 $ 37,500
Chadwick Co. stock 1,260 52 65,520 63,770
$103,770 $101,270

Note 2. The investment in Jolly Roger Co. stock is an equity method investment representing 30% of the outstanding shares of Jolly Roger Co.

The following selected investment transactions occurred during 2015:

May 5. Purchased 3,080 shares of Gozar Inc. at $30 per share including brokerage commission. Gozar Inc. is classified as an available-for-sale security.

Oct. 1. Purchased $40,000 of Nightline Co. 6%, 10-year bonds at 100. The bonds are classified as available for sale. The bonds pay interest on October 1 and April 1.

9. Dividends of $12,500 are received on the Jolly Roger Co. investment.

Dec. 31. Jolly Roger Co. reported a total net income of $112,000 for 2015. O’Brien Industries Inc. recorded equity earnings for its share of Jolly Roger Co. net income.

31. Accrued three months of interest on the Nightline bonds.

31. Adjusted the available-for-sale investment portfolio to fair value, using the following fair value per-share amounts:


Available-for-Sale
Investments Fair Value
Bernard Co. stock $15.40 per share
Chadwick Co. stock $46.00 per share
Gozar Inc. stock $32.00 per share
Nightline Co. bonds $98 per $100 of face amount


31. Closed the O’Brien Industries Inc. net income of $146,230 for 2015. O’Brien Industries Inc. paid no dividends during 2015.


Instructions

Determine the missing letters in the unclassified balance sheet. Provide appropriate supporting calculations.


Answer:


a. $236,170 (see table below)
b. $(5,800) ($230,370 – $236,170, from table)
c. $230,370 (from table)
Market
Cost per Value per
No. of Share (or Share (or
Shares (or $100 of $100 of Total Fair
Investments face amount) face amount) face amount) Cost Value
Bernard Co. stock……… 2,250 $17.00 $15.40 $ 38,250 $ 34,650
Chadwick Co. stock… 1,260 52.00 46.00 65,520 57,960
Gozar Inc. stock……… 3,080 30.00 32.00 92,400 98,560
Nightline Co. bonds…… $40,000 100 98 40,000 39,200
$236,170 $230,370
d. $600 ($40,000 × 6% × 3/12)
e. $98,100 [$77,000 + ($112,000 × 30%) – $12,500]
f. $813,600 ($233,000 + $136,530 + $230,370 + $600 + $98,100 + $115,000)
g. $455,000 ($308,770 + $146,230)
h. $(5,800) [same as (b)]
i. $813,600 ($69,400 + $70,000 + $225,000 + $455,000 – $5,800)
The completed comparative unclassified balance sheets are as follows:
O'BRIEN INDUSTRIES, INC.
Balance Sheet
December 31, 2015 and 2014
Dec. 31,
2015
Dec. 31,
2014
Cash $233,000 $220,000
Accounts receivable (net) 136,530 138,000
Available-for-sale investments (at cost)—Note 1 $236,170 $103,770
Less valuation allowance for available-for-sale
investments 5,800 2,500
Available-for-sale investments (fair value) $230,370 $101,270
Interest receivable $ 600 —
Investment in Jolly Roger Co. stock—Note 2 98,100 $ 77,000
Office equipment (net) 115,000 130,000
Total assets $813,600 $666,270
Accounts payable $ 69,400 $ 60,000
Common stock 70,000 70,000
Excess of issue price over par 225,000 225,000
Retained earnings 455,000 308,770
Unrealized gain (loss) on available-for-sale
investments (5,800) 2,500
Total liabilities and stockholders’ equity $813,600 $666,270
Note 1. Investments are classified as available for sale. The investments at cost
and fair value on December 31, 2014, are as follows:
No. of Cost per Total Total Fair
Shares Share Cost Value
Bernard Co. stock………………………… 2,250 $17.00 $ 38,250 $ 37,500
Chadwick Co. stock……………………… 1,260 52.00 65,520 63,770
$103,770 $101,270
For December 31, 2015:
Market
Cost per Value per
No. of Share (or Share (or
Shares (or $100 of $100 of Total Fair
face amount) face amount) face amount) Cost Value
Bernard Co. stock…… 2,250 $17.00 $15.40 $ 38,250 $ 34,650
Chadwick Co. stock 1,260 52.00 46.00 65,520 57,960
Gozar Inc. stock……… 3,080 30.00 32.00 92,400 98,560
Nightline Co. bonds $40,000 100 98 40,000 39,200
$236,170 $230,370
Note 2. The investment in Jolly Roger Co. stock is an equity method 

PR 15-3A Stock investment transactions, equity method and available-for-sale securities

Daffitar Inc. produces and sells theater set designs and costumes. The company began operations on January 1, 2014. The following transactions relate to securities acquired by Daffitar Inc., which has a fiscal year ending on December 31:


2014
Feb. 1. Purchased 12,000 shares of Acuity Inc. as an available-for-sale security at $27 per share, including the brokerage commission.

Mar. 18. Received a cash dividend of $0.18 per share on Acuity Inc. stock.

Sept.12. A cash dividend of $0.24 per share was received on the Acuity stock.

28. Sold 1,000 shares of Acuity Inc. stock at $21 per share, less a brokerage commission of $50.

Dec. 31. Acuity Inc. is classified as an available-for-sale investment and is adjusted to a fair value of $33 per share. Use the valuation allowance for available-for-sale investments account in making the adjustment.


2015
Jan. 23. Purchased an influential interest in Shouse Inc. for $376,000 by purchasing 70,000 shares directly from the estate of the founder of Shouse Inc. There are 250,000 shares of Shouse Inc. stock outstanding.

Mar. 16. Received a cash dividend of $0.24 per share on Acuity Inc. stock.

Sept.16. Received a cash dividend of $0.24 per share plus an extra dividend of $0.06 per share on Acuity Inc. stock.

Dec. 31. Received $30,100 of cash dividends on Shouse Inc. stock. Shouse Inc. reported net income of $190,000 in 2015. Daffitar Inc. uses the equity method of accounting for its investment in Shouse Inc.

31. Acuity Inc. is classified as an available-for-sale investment and is adjusted to a fair value of $30 per share. Use the valuation allowance for available-for sale investments account in making the adjustment for the decrease in fair value from $33 to $30 per share.

Instructions

1. Journalize the entries to record these transactions.

2. Prepare the investment-related asset and stockholders’ equity balance sheet presentation for Daffitar Inc. on December 31, 2015, assuming the Retained Earnings balance on December 31, 2015, is $465,000.


Answer:


1.

2014
Feb. 1 Investments—Acuity Inc.* 324,000
Cash 324,000
*12,000 shares × $27 per share
Mar. 18 Cash* 2,160
Dividend Revenue 2,160
*12,000 shares × $0.18 per share
Sept. 12 Cash* 2,880
Dividend Revenue 2,880
*12,000 shares × $0.24 per share
28 Cash* 20,950
Loss on Sale of Investments 6,050
Investments—Acuity Inc.** 27,000
*(1,000 shares × $21.00) – $50
**1,000 shares × $27 per share
Dec. 31 Valuation Allowance for Available-forSale
Investments 66,000
Unrealized Gain (Loss) on Available-forSale
Investments 66,000
11,000 shares × ($33.00 – $27.00).
2015
Jan. 23 Investment in Shouse Inc. Stock 376,000
Cash 376,000
Mar. 16 Cash* 2,640
Dividend Revenue 2,640
*(12,000 shares – 1,000 shares) × $0.24 per share
Sept. 16 Cash* 3,300
Dividend Revenue 3,300
*11,000 shares × ($0.24 + $0.06)
Dec. 31 Cash 30,100
Investment in Shouse Inc. Stock 30,100
31 Investment in Shouse Inc. Stock 53,200
Income of Shouse Inc. 53,200
To record 28% of Shouse Inc.
income $190,000 × (70,000 shares ÷
250,000 shares).
31 Unrealized Gain (Loss) on Available-forSale
Investments 33,000
Valuation Allowance for Available-forSale
Investments* 33,000
*($30.00 – $33.00) × 11,000 shares 
2.
 DAFFITAR INC.
Balance Sheet (selected items)
December 31, 2015
Current assets:
Available-for-sale investments (at cost)
1 $297,000
Plus valuation allowance for available-forsale
investments 33,000
Available-for-sale investments (at fair value)
2 $330,000
Investments:
Investment in Shouse Inc. stock3 $399,100
Stockholders’ equity:
Retained earnings $465,000
Unrealized gain (loss) on available-for-sale
investments 33,000
1 11,000 shares × $27 per share
2 11,000 shares × $30 per share
3 $376,000 + $53,200 – $30,100

PR 15-2A Stock investment transactions, trading securities

Scofield Financial Co. is a regional insurance company that began operations on January 1, 2014. The following transactions relate to trading securities acquired by Scofield Financial Co., which has a fiscal year ending on December 31:

2014
Mar. 14. Purchased 5,000 shares of Wilkomm Inc. as a trading security at $40 per share plus a brokerage commission of $500.

Apr. 24. Purchased 1,800 shares of McMarsh Inc. as a trading security at $50 plus a brokerage commission of $198.

June 1. Sold 2,600 shares of Wilkomm Inc. for $38 per share less a $100 brokerage  commission.

30. Received an annual dividend of $0.35 per share on Wilkomm Inc. stock.

Dec. 31. The portfolio of trading securities was adjusted to fair values of $38 and $49 per share for Wilkomm Inc. and McMarsh Inc., respectively.

2015

Apr. 4. Purchased 3,500 shares of Daley Inc. as a trading security at $30 per share plus a $175 brokerage commission.

June 28. Received an annual dividend of $0.40 per share on Wilkomm Inc. stock. sept. 9. Sold 700 shares of Daley Inc. for $32 per share less a $50 brokerage commission.

Dec. 31. The portfolio of trading securities had a cost of $270,578 and a fair value of $350,000, requiring a debit balance in Valuation Allowance for Trading Investments of $79,422 ($350,000 2 $270,578). Thus, the credit balance from December 31, 2014, is to be adjusted to the new balance.


Instructions

1. Journalize the entries to record these transactions.

2. Prepare the investment-related current asset balance sheet presentation for Scofield Financial Co. on December 31, 2015.

3. How are unrealized gains or losses on trading investments presented in the financial statements of Scofield Financial Co.?


Answer:


1.

2014
Mar. 14 Investments—Wilkomm Inc.* 200,500
Cash 200,500
*(5,000 shares × $40 per share) + $500
Apr. 24 Investments—McMarsh Inc.* 90,198
Cash 90,198
*(1,800 shares × $50 per share) + $198
June 1 Cash* 98,700
Loss on Sale of Investments 5,560
Investments—Wilkomm Inc.** 104,260
*(2,600 shares × $38.00 per share) – $100
**2,600 shares × ($200,500 ÷ 5,000 shares)
30 Cash* 840
Dividend Revenue 840
*(5,000 shares – 2,600 shares) × $0.35
Dec. 31 Unrealized Loss on Trading Investments 7,038
Valuation Allowance for Trading
Investments* 7,038
* $179,400 – $186,438, in table below
Number Cost
of per Fair Value Fair
Shares Share per Share Cost Value
Wilkomm Inc. ………………… 2,400 $40.101 $38 $ 96,240 $ 91,200
McMarsh Inc. ………………… 1,800 $50.112 $49 90,198 88,200
Total………………………… $186,438 $179,400
1 $200,500 ÷ 5,000 shares = $40.10 per share
2 $90,198 ÷ 1,800 shares = $50.11 per share
2015
Apr. 4 Investments—Daley Inc.* 105,175
Cash 105,175
*(3,500 shares × $30 per share) + $175
June 28 Cash* 960
Dividend Revenue 960
*2,400 shares × $0.40 per share
Sept. 9 Cash* 22,350
Gain on Sale of Investments 1,315
Investments—Daley Inc.** 21,035
*(700 shares × $32 per share) – $50
**700 shares × ($105,175 ÷ 3,500 shares)
Dec. 31 Valuation Allowance for Trading Investments* 86,460
Unrealized Ga
2.
 SCOFIELD FINANCIAL CO.
Balance Sheet (selected items)
December 31, 2015
Current assets:
Trading investments (at cost) $270,578
Plus valuation allowance for trading investments 79,422
Trading investments (at fair value) $350,000
3. Unrealized gains or losses are reported on the income statement, often as
“Other Income (Losses).” For 2014, Scofield Financial Co. would have
reported an unrealized loss of $7,038 as “Other Losses.” For 2015, Scofield
Financial Co. would have reported an unrealized gain of $86,460 as “Other
Income.” If unrealized gains and losses were significant for Scofield Financial,
then they would be separately disclosed on the income statement.

PR 15-1A Debt investment transactions, available-for-sale valuation

Baldwin Inc. is an athletic footware company that began operations on January 1, 2014. The following transactions relate to debt investments acquired by Baldwin Inc., which has a fiscal year ending on December 31:

2014

Mar. 1. Purchased $50,000 of Buncombe Co. 6%, 10-year bonds at their face amount plus accrued interest of $250. The bonds pay interest semiannually on February 1 and August 1.

16. Purchased $84,000 of French Broad 5%, 15-year bonds at their face amount plus accrued interest of $175. The bonds pay interest semiannually on March 1 and September 1.

Aug. 1. Received semiannual interest on the Buncombe Co. bonds.

31. Sold $20,000 of Buncombe Co. bonds at 99 plus accrued interest of $100.

Sept. 1. Received semiannual interest on the French Broad bonds.

Dec. 31. Accrued $750 interest on the Buncombe Co. bonds. 31. Accrued $1,400 interest on the French Broad bonds.

2015

Feb. 1. Received semiannual interest on the Buncombe Co. bonds.

Mar. 1. Received semiannual interest on the French Broad bonds.

Instructions
1. Journalize the entries to record these transactions.

2. If the bond portfolio is classified as available for sale, what impact would this have on financial statement disclosure?


Answer:


1.
 2014
Mar. 1 Investments—Buncombe Co. Bonds 50,000
Interest Receivable 250
Cash 50,250
16 Investments—French Broad Bonds 84,000
Interest Receivable 175
Cash 84,175
Aug. 1 Cash* 1,500
Interest Receivable 250
Interest Revenue 1,250
*$50,000 × 6% × 1/2
31 Cash* 19,900
Loss on Sale of Investment 200
Interest Revenue 100
Investments—Buncombe Co. Bonds 20,000
*($20,000 × 0.99) + $100
Sept. 1 Cash* 2,100
Interest Receivable 175
Interest Revenue 1,925
*$84,000 × 5% × 1/2
Dec. 31 Interest Receivable 750
Interest Revenue 750
31 Interest Receivable 1,400
Interest Revenue 1,400
2015
Feb. 1 Cash* 900
Interest Receivable 750
Interest Revenue 150
*$30,000 × 6% × 1/2
Mar. 1 Cash* 2,100
Interest Receivable 1,400
Interest Revenue 700
*$84,000 × 5% × 1/2
2. If the bonds are classified as available-for-sale securities, then the portfolio
of bonds would need to be adjusted to fair value. This would be accomplished
by using a valuation allowance account and an unrealized gain (loss) account as
part of stockholders’ equity. If the fair value were greater than the cost of the
bond portfolio, the two accounts would be positive, and thus added to investments
and stockholders’ equity, respectively. If the fair value were less than the cost of the
bond portfolio, the two accounts would be negative, and thus subtracted from
investments and stockholders’ equity, respectively.

Appendix EX 15-29 Comprehensive income

On December 31, 2013, Valur Co. had the following available-for-sale investment disclosure within the Current Assets section of the balance sheet:


Available-for-sale investments (at cost) $145,000
Plus valuation allowance for available-for-sale investments 40,000
Available-for-sale investments (at fair value) $185,000


There were no purchases or sales of available-for-sale investments during 2014. On December 31, 2014, the fair value of the available-for-sale investment portfolio was $200,000. The net income of Valur Co. was $210,000 for 2014.

Compute the comprehensive income for Valur Co. for the year ended December 31, 2014.


Answer:

VALUR CO.
For the Year Ended December 31, 2014
Net income $210,000
Other comprehensive income (loss):
Unrealized gain on available-for-sale investments* 15,000
Comprehensive income $225,000
* $200,000 – $185,000

EX 15-27 Dividend yield

eBay Inc. developed a Web-based marketplace at http://www.ebay.com, in which individuals can buy and sell a variety of items. eBay also acquired PayPal, an online payments system that allows businesses and individuals to send and receive online payments securely. In a recent annual report, eBay published the following dividend policy:

We have never paid cash dividends on our stock and currently anticipate that we will continue to retain any future earnings for the foreseeable future.

Given eBay’s dividend policy, why would an investor be attracted to its stock?


Answer:
The investor would receive a return on the investment through share price appreciation as internally generated funds are used to fund growth and earnings opportunities. Thus, investors in eBay would likely approve of this policy, because the company is able to earn superior returns with internally generated earnings beyond what investors could likely earn on their own by investing dividend distributions.

Appendix EX 15-28 Comprehensive income

On May 12, 2014, Chewco Co. purchased 2,000 shares of Jedi Inc. for $112 per share, including the brokerage commission. The Jedi investment was classified as an available-for-sale security.

On December 31, 2014, the fair value of Jedi Inc. was $124 per share. The net income of Chewco Co. was $50,000 for 2014.

Compute the comprehensive income for Chewco Co. for the year ended December 31, 2014.


Answer:

CHEWCO CO.
For the Year Ended December 31, 2014
Net income $50,000
Other comprehensive income (loss):
Unrealized gain on available-for-sale investments* 24,000
Comprehensive income $74,000
* 2,000 shares × ($124 per share – $112 per share)

EX 15-24 Balance sheet presentation of available-for-sale investments

During 2014, Copernicus Corporation held a portfolio of available-for-sale securities having a cost of $185,000. There were no purchases or sales of investments during the year. The market values at the beginning and end of the year were $225,000 and $160,000, respectively. The net income for 2014 was $180,000, and no dividends were paid during the year. The Stockholders’ Equity section of the balance sheet was as follows on December 31, 2013:


Copernicus Corporation
Stockholders’ Equity
December 31, 2013
Common stock $ 50,000
Paid-in capital in excess of par 250,000
Retained earnings 340,000
Unrealized gain (loss) on available-for-sale investments 40,000
Total $680,000


Prepare the Stockholders’ Equity section of the balance sheet for December 31, 2014.


Answer:

COPERNICUS CORPORATION
Balance Sheet (selected Stockholders’ Equity items)
December 31, 2014
Common stock $ 50,000
Paid-in capital in excess of par 250,000
Retained earnings* 520,000
Unrealized gain (loss) on available-for-sale investments** (25,000)
Total $795,000
* $340,000 + $180,000
** $40,000 + ($160,000 – $225,000), or $160,000 – $185,000

EX 15-25 Dividend yield

At the market close on October 27 of a recent year, McDonald’s Corporation had a closing stock price of $93.49. In addition, McDonald’s Corporation had a dividend per share of $2.44 during the previous year.

Determine McDonald’s Corporation’s dividend yield. (Round to one decimal place.)


Answer:

Dividend Yield = Cash Dividends per Share of Common Stock
Market Price per Share of Common Stock
Dividend Yield = $2.44
$93.49 = 2.6%

EX 15-26 Dividend yield

The market price for Microsoft Corporation closed at $30.48 and $27.91 on December 31, Year 1, and Year 2, respectively. The dividends per share were $0.52 for Year 1 and $0.52 for Year 2.

a. Determine the dividend yield for Microsoft on December 31, Year 1, and Year 2.
(Round percentages to two decimal places.)

b. Interpret these measures.


Answer:
a.
Year 1: Dividend Yield = $0.52 ÷ $30.48 = 1.71%
Year 2: Dividend Yield = $0.52 ÷ $27.91 = 1.86%

b. Dividends per share remained constant from Year 1 to Year 2. In addition, the dividend yield increased from 1.71% in Year 1 to 1.86% in Year 2. The increase in the dividend yield is a result of a slight decrease in the stock price. Microsoft provides a small return to the shareholder in terms of a dividend yield and an additional return in terms of price appreciation of the stock.

EX 15-23 Balance sheet presentation of available-for-sale investments

During 2014, its first year of operations, Galileo Company purchased two available-forsale investments as follows:


Security Shares Purchased Cost
Hawking Inc. 900 $44,000
Pavlov Co. 1,780 38,000


Assume that as of December 31, 2014, the Hawking Inc. stock had a market value of $50 per share, and the Pavlov Co. stock had a market value of $24 per share. Galileo Company had net income of $300,000, and paid no dividends for the year ended December 31, 2014. All of the available-for-sale investments are classified as current assets.

a. Prepare the Current Assets section of the balance sheet presentation for the availablefor-sale investments.

b. Prepare the Stockholders’ Equity section of the balance sheet to reflect the earnings and unrealized gain (loss) for the available-for-sale investments.


Answer:

a. GALILEO COMPANY
Balance Sheet (selected items)
December 31, 2014
Assets
Current assets:
Available-for-sale investments, at cost $82,000
Plus valuation allowance for available-for-sale
investments* 5,720 $87,720
* Computation:
Market:
Hawking Inc.: 900 shares × $50…………………………………………… $45,000
Pavlov Co.: 1,780 shares × $24…………………………………………… 42,720
$87,720
Cost ($44,000 + $38,000)………………………………………………………… 82,000
Unrealized gain…………………………………………………………………… $ 5,720

b. GALILEO COMPANY
Balance Sheet (selected items)
December 31, 2014
Stockholders’ Equity
Retained earnings $300,000
Unrealized gain (loss) on available-for-sale
investments 5,720

EX 15-22 Fair value journal entries, available-for-sale investments

Storm, Inc. purchased the following available-for-sale securities during 2014, its first year of operations:


Name Number of Shares Cost
Dust Devil, Inc. 1,900 $ 81,700
Gale Co. 850 68,000
Whirlwind Co. 2,850 114,000
Total $263,700
The market price per share for the available-for-sale security portfolio on December
31, 2014, was as follows:
Market Price per Share,
Dec. 31, 2014
Dust Devil, Inc. $40
Gale Co. 75
Whirlwind Co. 42


a. Provide the journal entry to adjust the available-for-sale security portfolio to fair value on December 31, 2014.

b. Describe the income statement impact from the December 31, 2014, journal entry.


Answer:

2014
a. Dec. 31 Unrealized Gain (Loss) on Available-forSale
Investments 4,250
Valuation Allowance for Available-forSale
Investments* 4,250
* $259,450 – $263,700, as determined from the following schedule:
Cost
Fair Value
(Dec. 31, 2014)
Dust Devil, Inc. …………………………………………………………………… $ 81,700 $ 76,0001
Gale Co. …………………………………………………………………………. 68,000 63,7502
Whirlwind Co. …………………………………………………………………… 114,000 119,7003
Total………………………………………………………………………….. $263,700 $259,450
1 1,900 shares × $40 per share
2 850 shares × $75 per share
3 2,850 shares × $42 per share
b. There is no income statement impact from the December 31, 2014, adjusting
entry. Unrealized Gain (Loss) on Available-for-Sale Investments is reported
in the Stockholders’ Equity section of the balance sheet. On December 31,
2014, Unrealized Gain or Loss on Available-for-Sale Investments would be
disclosed as follows:
Unrealized gain (loss) on available-for-sale investments…………………… $(4,250)

EX 15-21 Fair value journal entries, available-for-sale investments

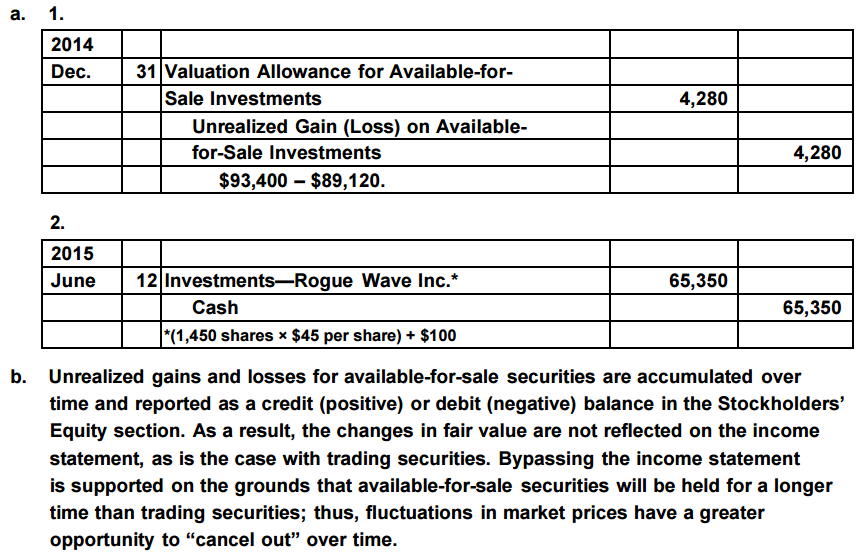
Hurricane Inc. purchased a portfolio of available-for-sale securities in 2014, its first year of operations. The cost and fair value of this portfolio on December 31, 2014, was as follows:


Name Number of Shares Total Cost Total Fair Value
Tornado Inc. 800 $14,000 $15,600
Tsunami Corp. 1,250 31,250 35,000
Typhoon Corp. 2,140 43,870 42,800
Total $89,120 $93,400


On June 12, 2015, Hurricane purchased 1,450 shares of Rogue Wave Inc. at $45 per share plus a $100 brokerage fee.

a. Provide the journal entries to record the following:

1. The adjustment of the available-for-sale security portfolio to fair value on December 31, 2014.
2. The June 12, 2015, purchase of Rogue Wave Inc. stock.

b. How are unrealized gains and losses treated differently for available-for-sale securities than for trading securities?


Answer:

a. 1.
2014
Dec. 31 Valuation Allowance for Available-forSale
Investments 4,280
Unrealized Gain (Loss) on Availablefor-Sale
Investments 4,280
$93,400 – $89,120.
2.
2015
June 12 Investments—Rogue Wave Inc.* 65,350
Cash 65,350
*(1,450 shares × $45 per share) + $100
b. Unrealized gains and losses for available-for-sale securities are accumulated over
time and reported as a credit (positive) or debit (negative) balance in the Stockholders’
Equity section. As a result, the changes in fair value are not reflected on the income
statement, as is the case with trading securities. Bypassing the income statement
is supported on the grounds that available-for-sale securities will be held for a longer
time than trading securities; thus, fluctuations in market prices have a greater
opportunity to “cancel out” over time.

EX 15-19 Missing statement items, available-for-sale securities

Highland Industries Inc. makes investments in available-for-sale securities. Selected income statement items for the years ended December 31, 2014 and 2015, plus selected items from comparative balance sheets, are as follows:


Highland Industries Inc.
Selected Income Statement Items
For the Years Ended December 31, 2014 and 2015
2014 2015
Operating income a. g.
Gain (loss) from sale of investments $7,500 $(12,000)
Net income (loss) b. (21,000)
Highland Industries Inc.
Selected Balance Sheet Items
December 31, 2013, 2014, and 2015
Dec. 31, 2013 Dec. 31, 2014 Dec. 31, 2015
Assets
Available-for-sale investments, at cost $ 90,000 $ 86,000 $102,000
Valuation allowance for available-for-sale investments 12,000 (11,000) h.
Available-for-sale investments, at fair value c. e. i.
Stockholders’ Equity
Unrealized gain (loss) on available-for-sale investments d. f. (16,400)
Retained earnings $175,400 $220,000 j.

There were no dividends.

Determine the missing lettered items.


Answer:
a. $37,100 $44,600 – $7,500
b. $44,600 $220,000 – $175,400
c. $102,000 $90,000 + $12,000
d. $12,000 Same as valuation allowance for available-for-sale investments
e. $75,000 $86,000 – $11,000
f. ($11,000) Same as valuation allowance for available-for-sale investments
g. ($9,000) ($21,000) + $12,000
h. ($16,400) Same as unrealized gain (loss) from available-for-sale investments
i. $85,600 $102,000 – $16,400
j. $199,000 $220,000 – $21,000

EX 15-20 Fair value journal entries, available-for-sale investments

The investments of Steelers Inc. include a single investment: 33,100 shares of Bengals Inc. common stock purchased on September 12, 2014, for $13 per share including brokerage commission. These shares were classified as available-for-sale securities. As of the December 31, 2014, balance sheet date, the share price declined to $11 per share.


a. Journalize the entries to acquire the investment on September 12 and record the adjustment to fair value on December 31, 2014.

b. How is the unrealized gain or loss for available-for-sale investments disclosed on the financial statements?


Answer:

a.
2014
Sept. 12 Investments—Bengals Inc. Stock 430,300
Cash 430,300
33,100 shares × $13 per share.
Dec. 31 Unrealized Gain (Loss) on Available-forSale
Investments 66,200
Valuation Allowance for Available-for-Sale
Investments 66,200
33,100 shares × ($11 per share – $13 per
share).
b. Unrealized Gain (Loss) on Available-for-Sale Investments is reported in the Stockholde
Equity section of the balance sheet, separately from the retained earnings or paid-in
capital accounts. On December 31, 2014, the account would show a debit balance of
$66,200, which would be subtracted from stockholders’ equity.